We make the claim that we are the #1 Asset Management Solution. It’s on our marketing materials. It’s on our website. It’s a statement we stand behind. But, to understand why we make this bold claim we need to explain how ManagerPlus is different from other asset management systems. So throughout the next few blog posts, we’re going to dive into how we designed ManagerPlus and what makes it the #1 Asset Management Solution.
It Starts with a Dashboard
In ManagerPlus, we start with a Dashboard. That’s because the first thing you see when you log into ManagerPlus is a Dashboard. It contains graphs and numbers with data from inside of the ManagerPlus database. These graphs and numbers may seem random without explanation, but when you understand what they represent, and how to get your own custom Dashboard, they have the power to completely transform businesses.
Take, for example, this Maintenance Dashboard:
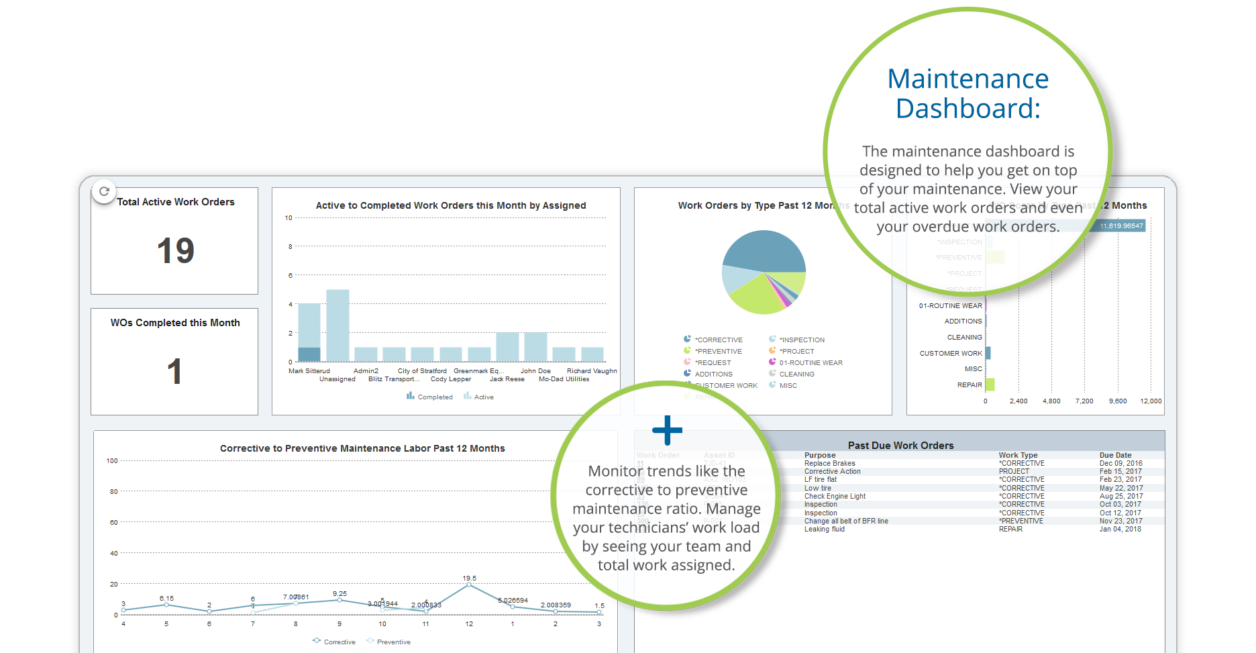
The top left panel shows the total number of active work orders that have been created. The panel below it shows the number of work orders that have been completed in the current month. In two simple numbers, you have a clear picture of the work on your plate and how that compares with what you’ve already done. But this is just the beginning.
What it all means
If you look at the panel on the top right, you’ll see a graph labeled “WO Costs by Type Past 12 Months.” With just a glance, you can see that two types of work orders are costing your organization significantly more than the other two. Clicking on one of the bars will show exactly which work orders appear in this group. This allows you to get a clear picture of where you have potential for saving money.
The other panels show other useful things, like how many work orders your individual employees have completed, what types of work orders have been completed in the past 12 months, and what your moving ratio of corrective to preventive maintenance is. These different panels can give you deeply insightful information and give you real, actionable solutions.
But, what if you want to know something else? This is what truly sets ManagerPlus apart from everyone else in the market.
What else can I put on a Dashboard?
Let’s say that you have three different production lines in your manufacturing plant. ManagerPlus can isolate labor, costs, and even inventory usage from those different production lines to show you exactly what each line is costing you. Depending on how you’ve segmented your departments and organized your assets, a nearly unlimited amount of data is available to you. You can see direct comparisons that are uniquely useful to your business.
Imagine being able to know exactly which vehicles in your fleet are costing you more than others. Imagine being able to know whether it’s because of the particular model or the person behind the wheel. Imagine being able to watch your fleet’s health in real time and knowing exactly when it’s time to disposition a vehicle. ManagerPlus can do this.
Imagine knowing which departments are the most expensive, and which assets in those departments are causing the costs. Department costs could be easily be analyzed and inefficiencies could be addressed. Imagine if all optimizations you discovered could be applied across all of your different departments.
All this is to say that ManagerPlus is designed for much more than just tracking work orders. The ability to track assets and work is always a part of a larger picture that serves to enable growth in your business. Next week, we’ll be talking about where that data comes from and how ManagerPlus uses it to provide better, faster decisions and unlock your organization’s growth potential. We hope you’ll come along for the ride.
